St. Tammany Parish teacher, blogger, and inveterate pessimist Mercedes Schneider desperately wants to believe New Orleans’ Recovery School District – and by extension, its students – have failed.
For years, she has taken to her blog to malign the district at every available opportunity, dismissing evidence of the RSD’s progress as either smoke-and-mirrors or outright lies concocted by the bureaucrats at the Louisiana Department of Education. In fact, it seems every other week Schneider announces she’s uncovered another “bombshell” about New Orleans’ charter schools, discoveries that promise to bring down those treacherous officials at RSD and their evil overlords in Baton Rouge.1
I. Schneider: All Bombast, No Bombshell
Her latest “bombshell” centers on the RSD’s 2014 ACT test results, which Schneider accused the LDOE of intentionally withholding because they reveal the district is failing. So Schneider took matters into her own hands and published what she said were Louisiana’s statewide ACT scores. Claiming she received the data from “a friend works in admissions at one of Louisiana’s institutes of higher education,” Schneider said she was obligated to publish them in “an effort to finally offer the public RSD research that has not been warped and refashioned into the hologram of victory by a very-pro-privatizing Louisiana Department of Education (LDOE).”2

However, when LDOE released the official ACT results last week, they showed that Schneider’s numbers were incomplete and inaccurate.3 But when faced with the news that her ACT data was flawed, what did Mercedes do? Well, like any self-righteous anti-education reform crusader, she steadfastly refused to let something as nit-picky as objective facts stand in the way of her smear campaign. Over the past two weeks, she’s published a total of seven blog posts on the ACT scores, in which she uses faulty analysis to bolster her claim that the RSD is a sham.
II. Mercedes’ Inadvertent Case For Common Core Math
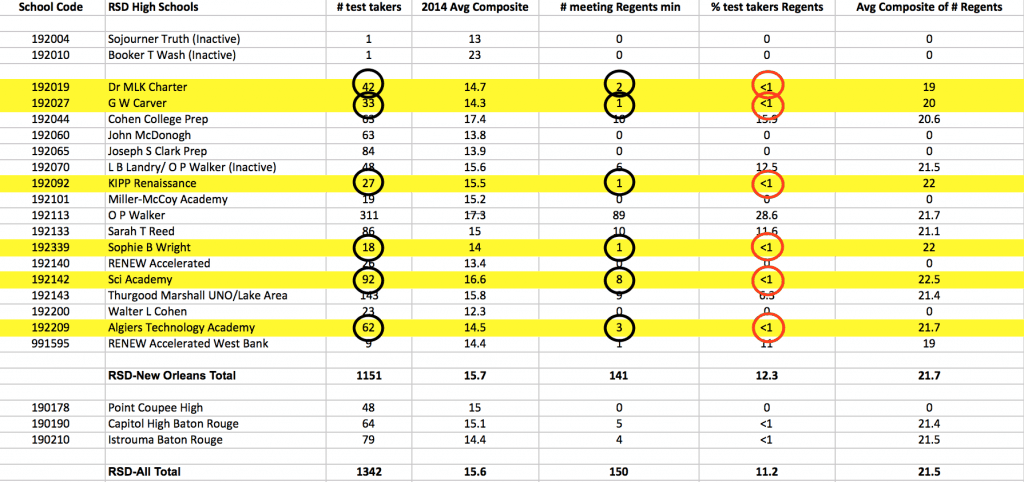
As I documented previously, although Schneider has a doctorate in statistics, you wouldn’t know it from her so-called “research” on the RSD, which is riddled with errors thanks to her sloppy methods and lack of context about New Orleans’ schools. For example, one of her recent posts looked at the percentage of students in the RSD who met the ACT requirements for TOPS – Louisiana’s public college and university scholarship program – which included a spreadsheet she created [see below] listing the number of TOPS-eligible students at each RSD high school. Schneider said her data shows “six RSD high schools each graduated less than one percent meeting the requirement, or 16 students out of 274 (5.8 percent).”

…Oh wait, no it doesn’t.
In fact, anyone who knows how to calculate percentages could tell you that more than 1% of students met the minimum ACT score requirement for TOPS at ALL six high schools referenced. I guess it’s a good thing Schneider teaches English and not math – thank god for small favors.
Furthermore, while Schneider also notes in the post that, “of the 16 active New Orleans RSD high schools, five graduated not one student meeting the Regents 18-English-19-math ACT requirement,” she fails to mention that one of those five schools is an alternative school, and another three either have closed or will close at the end of this school year.
This is a perfect illustration of Schneider’s modus operandi: she makes foolish mistakes and omits (or is unaware of) relevant facts because she isn’t trying to draw conclusions about the RSD’s performance. On the contrary, she’s already decided the RSD is a failure and simply tries to present data in a way that bolsters that conclusion.
III. The Real Story: Progress, Not Perfection
When we compare ACT performance between 2005 and 2014, the progress the RSD has made is clear. Let’s begin by looking at the Spring 2005 ACT Composite Scores in the 14 high schools that were taken over by the RSD after Hurricane Katrina:
2005 ACT Scores in High Schools Transferred to RSD
| School Name | 2005 Grad Count | ACT Count | ACT Comp. Avg. |
|---|---|---|---|
| Alcee Fortier | 113 | 39 | 14.4 |
| Booker T. Washington | 40 | 21 | 13.0 |
| Frederick A. Douglass | 63 | 36 | 14.6 |
| G.W. Carver | 102 | 54 | 14.6 |
| John F. Kennedy | 222 | 140 | 13.6 |
| John McDonogh | 153 | 100 | 14.0 |
| Joseph S. Clark | 84 | 35 | 14.2 |
| L.B. Landry | 65 | 36 | 14.4 |
| Rabouin Career Magnet | 122 | 102 | 15.0 |
| Lawless | 110 | 37 | 13.9 |
| Marion Abramson | 287 | 176 | 14.8 |
| O.P. Walker | 188 | 119 | 14.8 |
| Sarah T. Reed | 201 | 121 | 14.4 |
| Walter L. Cohen | 84 | 52 | 13.9 |
| OPSB Takeover High Schools | 1750 | 1068 | 14.4 |
The first thing to note is that nearly 40% of graduating seniors didn’t even take the ACT that year and it’s fair to assume that those students who did were considered by their school counselors to be “on-track” for college. Nevertheless, the average ACT Composite Score across those 14 schools was a dismal 14.4.
Now, let’s turn to this past year’s ACT scores in the RSD. Since the 2012-13 school year, all students have been required to take the ACT in order to graduate. Therefore, the ACT data from 2014 provides a much broader picture than the 2005 data, which excluded the 40% of seniors who never took the test. In spite of this fact, the average ACT Composite Score across the 16 non-alternative high schools in the RSD was 16.5, a gain of 2.1 points since 2005:
2014 ACT Scores in RSD High Schools (non-alternative)
| School Name | 2014 Grad Count | ACT Count | ACT Comp. Avg. |
|---|---|---|---|
| G.W. Carver | 33 | 43 | 15.2 |
| Sarah T. Reed | 75 | 68 | 14.5 |
| Walter L. Cohen | 35 | 31 | 13.7 |
| Algiers Technology Academy | 51 | 53 | 14.9 |
| Cohen College Prep | 52 | 53 | 18.7 |
| Dr. M.L.K. Charter | 35 | 39 | 15.3 |
| Carver Collegiate | NA | NA | NA |
| Carver Prep | NA | NA | NA |
| John McDonogh | 54 | 49 | 13.3 |
| Joseph S. Clark | 52 | 60 | 14.2 |
| KIPP Renaissance | 90 | 98 | 17.9 |
| Lake Area New Tech | 136 | 137 | 16.2 |
| Landry-Walker | 268 | 296 | 17.8 |
| Miller-McCoy Academy | 23 | 22 | 15.3 |
| Sci Academy | 76 | 82 | 18.2 |
| Sophie B. Wright | 63 | 75 | 17.1 |
| RSD High Schools (non-alternative) | 1043 | 1106 | 16.5 |
We see similar gains when we look at TOPS eligibility between 2005 and 2014. Only 5.6% of students who took the ACT in 2005 received TOPS-eligible scores in the 14 high schools that were taken over by the RSD:
2005 TOPS Eligibility in OPSB High Schools Transferred to RSD
| School Name | 10/1/04 Grade 12 Count | Graduate Count | TOPS Tech 2-year | TOPS 4-year | All TOPS Eligible |
|---|---|---|---|---|---|
| Alcee Fortier | 123 | 113 | 4 | 2 | 6 |
| Booker T. Washington | 50 | 40 | 2 | 0 | 2 |
| Frederick A. Douglass | 121 | 63 | 3 | 1 | 4 |
| G.W. Carver | 152 | 102 | 1 | 0 | 1 |
| John F. Kennedy | 284 | 222 | 8 | 0 | 8 |
| John McDonogh | 259 | 153 | 5 | 1 | 6 |
| Joseph S. Clark | 135 | 84 | 1 | 2 | 3 |
| L.B. Landry | 106 | 65 | 1 | 2 | 3 |
| Rabouin Career Magnet | 122 | 122 | 10 | 4 | 14 |
| Lawless | 127 | 110 | 2 | 0 | 2 |
| Marion Abramson | 384 | 287 | 32 | 8 | 40 |
| O.P. Walker | 204 | 188 | 4 | 1 | 5 |
| Sarah T. Reed | 244 | 201 | 2 | 1 | 3 |
| Walter L. Cohen | 113 | 84 | 5 | 0 | 5 |
| OPSB Takeover High Schools | 2424 | 1834 | 80 | 22 | 102 |
| % Totals: | 75.7% | 4.4% | 1.2% | 5.6% |
On the other hand, this past spring, nearly 23% of graduating seniors received a TOPS-eligible score:
2014 TOPS Eligibility in RSD High Schools (non-alternative)
| School Name | 10/1/13 Grade 12 Count | Graduate Count | TOPS Tech 2-year | TOPS 4-year | All TOPS Eligible |
|---|---|---|---|---|---|
| Algiers Technology Academy | 58 | 51 | 3 | 1 | 4 |
| Joseph S. Clark | 74 | 52 | NA | NA | NA |
| Cohen College Prep | 53 | 52 | 10 | 16 | 26 |
| Dr. M.L.K. Charter | 39 | 35 | 2 | 3 | 5 |
| Carver Collegiate | NA | NA | NA | NA | NA |
| Carver Prep | NA | NA | NA | NA | NA |
| G.W. Carver | 51 | 33 | 0 | 0 | 0 |
| John McDonogh | 107 | 54 | 4 | 1 | 5 |
| KIPP Renaissance | 102 | 90 | 19 | 22 | 41 |
| Landry-Walker | 314 | 268 | 21 | 36 | 57 |
| Lake Area New Tech | 132 | 136 | 24 | 8 | 32 |
| Miller-McCoy Academy | 25 | 23 | 0 | 3 | 3 |
| Sarah T. Reed | 92 | 75 | 3 | 0 | 3 |
| Sci Academy | 93 | 76 | 18 | 23 | 41 |
| Sophie B. Wright | 81 | 63 | 9 | 11 | 20 |
| Walter L. Cohen | 43 | 35 | 2 | 0 | 2 |
| RSD High Schools | 1264 | 1043 | 115 | 124 | 239 |
| % Totals: | 82.5% | 11% | 11.9% | 22.9% |
Admittedly, the data shows that we still have a long way to go when it comes to ensuring that all students in the RSD are college-ready by the time they graduate from high school. And, perhaps the gains the RSD has made over the past decade seem insignificant to Mercedes Schneider because she has had the luxury of teaching in the whiter, more affluent, and traditionally higher-performing district of St. Tammany Parish on the other side of Lake Ponchartrain:
| Site Name | 2005 ACT Comp. Avg. | 2014 ACT Comp. Avg. | 2005-2014 ACT Avg. Chg. | % FRPL Eligible (2014) | % Minority (2014) |
|---|---|---|---|---|---|
| RSD-NO High Schools (non-alternative) | 14.4 | 16.5 | +2.1 | ≈ 91% | ≈ 99% |
| Slidell High School | 20.8 | 20.4 | -0.4 | ≈ 49% | ≈ 39% |
Still, the progress the RSD has made over the past ten years is significant, especially considering where we started back in 2005, and it will no doubt continue to improve – I just wouldn’t count on Mercedes Schneider ever acknowledging that fact.

- Editors’ Note: As of publishing time, no treacherous RSD or LDOE officials had been brought down. ↩
- Editors’ Note: LDOE officials would neither confirm nor deny the existence of these so-called “victory holograms.” ↩
- For the sake of brevity, I refrained from enumerating the lengthy list of disparities between the two data sets, but you can compare them for yourself here: Schneider’s 1/31/15 Data vs. LDOE Official ACT Results. ↩


@petercook @juscohen more off-putting was the overall “anti”-ness of the entire piece.
@geauxteacher Really? She made very basic arithmetic mistakes, which undermines her credibility. @keithleger1
@petercook @keithleger1 Oh poopie. That was a terrible review. Only the koolaid drinkers would buy that.