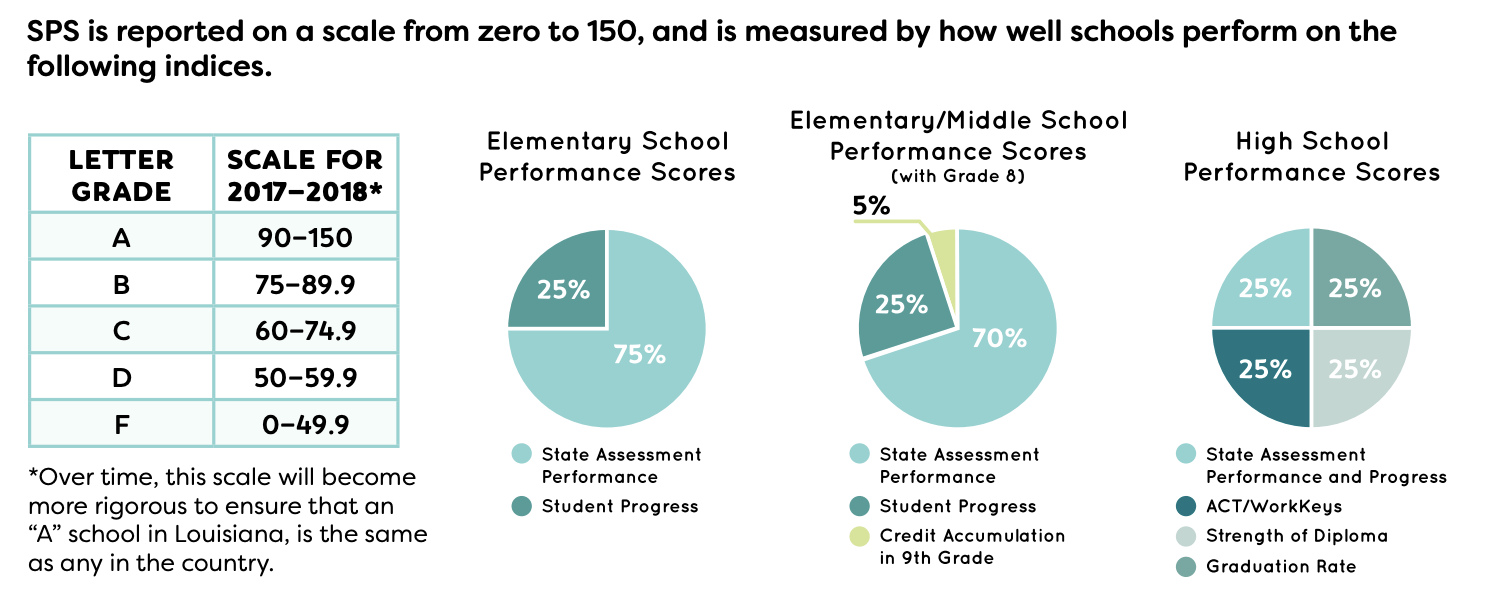
On Thursday, the Louisiana Department of Education (LDOE) released annual school letter grades and School Performance Scores (SPS) – which are akin to number grades – for the 2017-18 school year.
For the first time, the formulas used to measure school performance incorporate students’ growth from year to year on state standardized tests. Here’s how the change impacts performance measures at various grade configurations:
- For elementary grades, 25% of letter grades and SPS scores are based on student growth, with the rest based on an absolute measure of achievement on state standardized tests;
- For middle grades, 25% of letter grades and SPS scores are based on student growth, 70% is based on an absolute measure of student performance on tests, and 5% is based on a metric that measures how many credits their recently graduated students accumulate in their freshman year of high school.
- For high schools, 25% is based on a metric incorporating test performance and student growth, 25% is based on the cohort graduation rate, 25% is based on achievement on the ACT and career-readiness assessments, and the final 25% is based on a metric that takes into account in how many students take college-level classes (such as Advanced Placement) and earn Jump Start credentials.
Because the student growth measure is new this year, LDOE also included letter grades and SPS scores that were calculated using the old formula to make it easier to compare school performance between the 2016-17 and 2017-18 school years.
One final change to the accountability system also went into effect this year. Students now have to score “Mastery” or above to be counted as on grade level to earn points on the School Performance Score. Previously, students who scored “Basic” or above were considered on grade level. This essentially makes it harder for schools to earn an “A” rating.
Now let’s take a look at how school performance in New Orleans…
How did schools perform this year?
Under the new formula, out of 84 schools operating in New Orleans last year, nearly two-thirds received a grade of “C” or better. Only fifteen schools received failing grades, and of those, five are alternative schools and three were closed at the end of the year (and others in that unfortunate group will likely close at the end of the current school year).
As might be expected, the city’s selective admissions schools were among the highest performers in terms of SPS, with Ben Franklin High School once again securing the top spot with a score of 135.2. However, several open enrollment schools rounded out the top ten, including Warren Easton, Karr, Hynes, New Orleans Military & Maritime Academy (the perennial “sleeper” among the high performers), International School of La., and Alice Harte.
wpDataTable with provided ID not found!As for the schools that had biggest gains year-over-year, Mildred Osborne topped the list, with an SPS gain of 21.8 points (this is using the old formula to make the scores comparable), followed by Crocker (+15.7), McMain (+13.9), and Encore (+12.2). ReNEW McDonogh City Park also saw one of the biggest year-over-year jumps in SPS (12.8 points), which you have to respect, since the school was headed for closure at the end of school year and yet they went out with a bang.
On the other end of the spectrum, James M. Singleton had the biggest year-over-year drop in SPS, which isn’t much a surprise after the school was rocked by a testing scandal earlier this year which resulted in the resignations of several staff members, including the CEO. Robert Russa Moton, another school that has been under fire in recent months (in its case, for failing to serve special needs students), had the second biggest drop in the district, falling almost 19 SPS points between 2017 and 2018. Back in 2013, Moton was also investigated for cheating and Moton principal Paulette Bruno is battling a a five year-old charge of nepotism before the Louisiana Board of Ethics. Given all these problems, it kind of makes you wonder how these two schools are still open.
Which schools are the best/worst performing over the past five years?
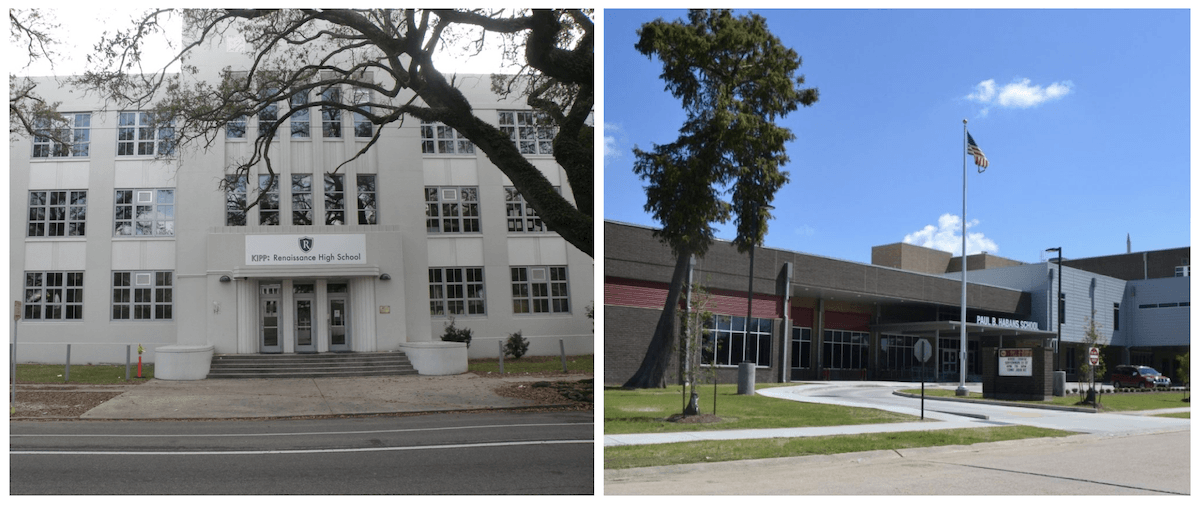
When we take a longer view of performance, the data gets even more interesting, because it surfaces a number of often-overlooked schools that have been quietly getting things done. The school with the biggest improvement over the past five years is KIPP Renaissance, which has seen its SPS score jump an impressive 38.8 points over that period. Paul Habans, is the second Most Improved Player in the district with an SPS gain of nearly 30 points since 2014. Other school improvement standouts include New Orleans Military and Maritime Academy (+27.1 – again, crushing it under-the-radar), Andrew Wilson (+24.4), and Mildred Osborne (+18.1).
Finally, we come to schools that have seen the biggest declines in SPS over the past five years. If we exclude schools that have been closed, once again Singleton comes out on bottom with a decline of 42.5 points. Landry-Walker High School, which was rocked by a testing scandal from which it hasn’t recovered, had the second biggest SPS drop (-40.4 points) since 2014. The school also received an “F” grade from LDOE on Thursday. Nevertheless, the school was inexplicably praised on social media by the Algiers Charter Schools Association for having “top growth” in Algebra I.
Landry-Walker leaders deceived everyone by cheating, scores then plummeted, and now they’re celebrating even though they just received a “F” from the state.
It’s like having a champagne toast on the deck of the Titanic. #NOLAed #LaEd https://t.co/LoGHw3MwfS
— Peter C. Cook (@petercook) November 9, 2018
As for the other biggest decliners over the past five years, there are few surprises. Pierre A. Capdau, which was one of the first schools taken over by the RSD prior to Hurricane Katrina, is still struggling all these years later, with its SPS score declining nearly 40 points since 2014. Einstein, which recently fought a legal battle against the district’s transportation requirements that blew up in its face, has declined by nearly 35 points. And rounding out the bottom five is another familiar name, Moton, which has seen its SPS score decline 32 points.
Compare how schools have performed over the past five years:
Use the filters on the right to compare the School Performance Scores of various schools between 2014 and 2018.