This story has been updated with additional information below.
The Louisiana Department of Education (LDOE) released 2016-17 School and District Performance Scores and letter grades on Tuesday, and while the summative performance of the state’s public schools rose from a “C” to a “B” this past year, the results from New Orleans’ schools can only be described as a train wreck. Three-fifths of the city’s public schools saw their performance scores decline in 2016-17 and the district’s overall grade dropped from a “B” to a “C”.
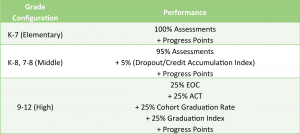
Every fall, LDOE issues updated letter grades and School Performance Scores (or SPS, which are akin to number grades) for every public school in the state. Scores for elementary schools are based entirely on standardized test results. For middle schools, 95% of SPS is based on testing and 5% is based on credits earned through the end of their students’ freshman year in high school. The SPS formula for high schools takes into account ACT and end-of-course test scores, a “graduation index” that measures factors like Advanced Placement participation, and the cohort graduation rate. All schools can receive bonus points if they make significant academic gains with struggling students.
These annual letter grades and performance scores not only provide families and policymakers with a clear picture of how schools are progressing, but they play an integral role in the state’s accountability system by identifying failing schools that require intervention and determining whether charters should be renewed.
The recent slump in performance in New Orleans couldn’t come at a worse time. More than a dozen charters are up for renewal before the end of the year and the Recovery School District (RSD) is scheduled to hand over control of its schools to the Orleans Parish School Board (OPSB) in July. That means RSD and OPSB officials will face difficult decisions over the fate of several schools in the coming months that will test their commitment to holding the city’s charters accountable. It also means that the city’s education leaders need to step back and identify the root causes of the drop in performance, as well as recommit themselves to focusing on academic achievement as their primary goal.
Now let’s take a closer examination of how schools fared in New Orleans…
The 15 worst performing schools in 2016-17
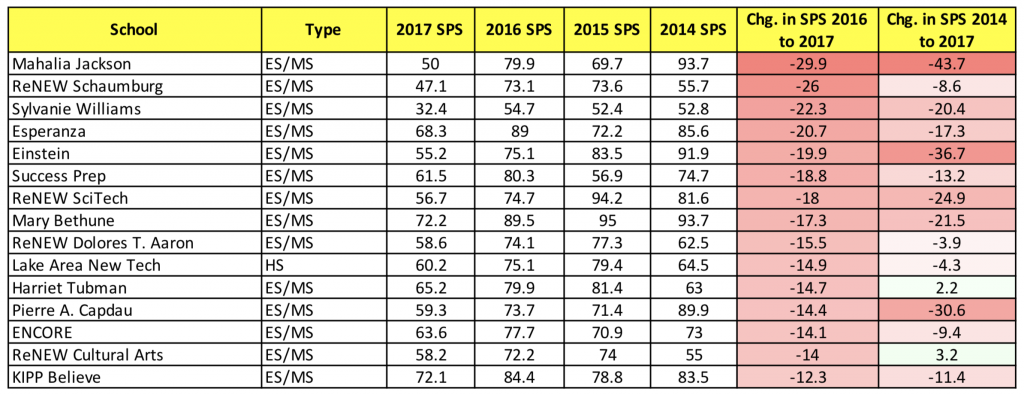
A number of things stand out when looking at the schools that saw the biggest SPS declines in 2016-17, but the most striking is that ReNEW Schools clearly had a terrible year. Four of the charter network’s schools – Schaumburg, Sci Tech, Dolores T. Aaron, and Cultural Arts Academy at Live Oak – ended up among fifteen worst-performing schools in the city.
While a case can certainly be made that Schaumburg’s dismal performance is attributable to the fact that it was struck by a tornado in February, it is much harder to make excuses for the other three ReNEW schools on the list. These results, coming on the heels of several scandals at ReNEW in recent years (including all sorts of malfeasance at ReNew SciTech), should raise serious questions about the future of the network.
It’s also interesting to note that Einstein finds itself among the worst-performing schools in the city. Not only has Einstein rapidly expanded its network of schools (and just got approval to open a new school in Little Rock), but OPSB recently cited Einstein for failing to provide bus transportation to many of its elementary students.
Einstein is currently gearing up for a legal fight over the district’s transportation mandate – a policy that every other school in the city has to follow – that they are unlikely to win. Perhaps if Einstein spent more time focused on academics and less on trying to skirt the rules, they wouldn’t find themselves near the bottom of the pile.
The 15 worst performing schools over the past four years
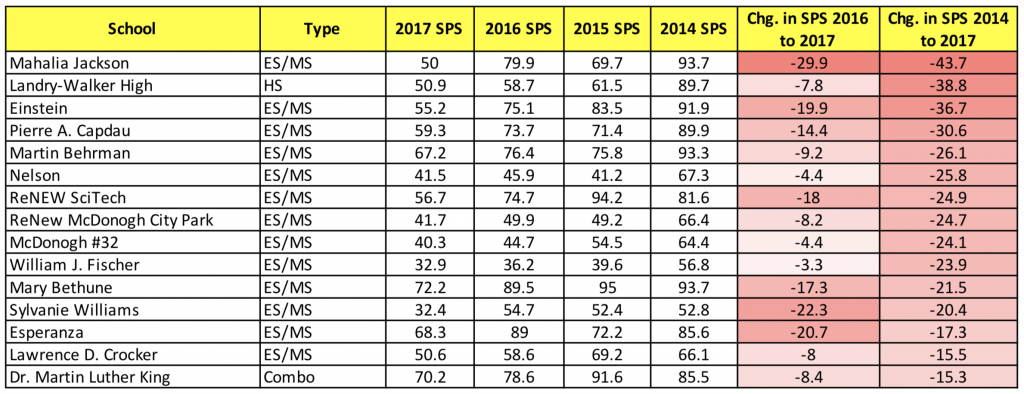
Looking at the fifteen worst performing schools over the past four years, two names in particular stand out: Capdau and Nelson. These two schools were the first taken over by the RSD in 2004 and the fact that they’re still struggling thirteen years later is inexcusable. (The same could be said of Fischer, which was notoriously bad long before Katrina.)
There are also a few surprises on the list, such as the fact that Dr. Martin Luther King Charter School now finds itself among the lowest of the low. King, which was the first school to reopen in the Lower Ninth Ward after Hurricane Katrina, was once celebrated as one of the highest-performing schools in the city. That luster has worn off over time (MLK’s leaders have, at different times, faced nepotism charges and been accused of turning away special needs students) and apparently the school’s academic performance has gone with it.
The 15 best performing schools in 2016-17
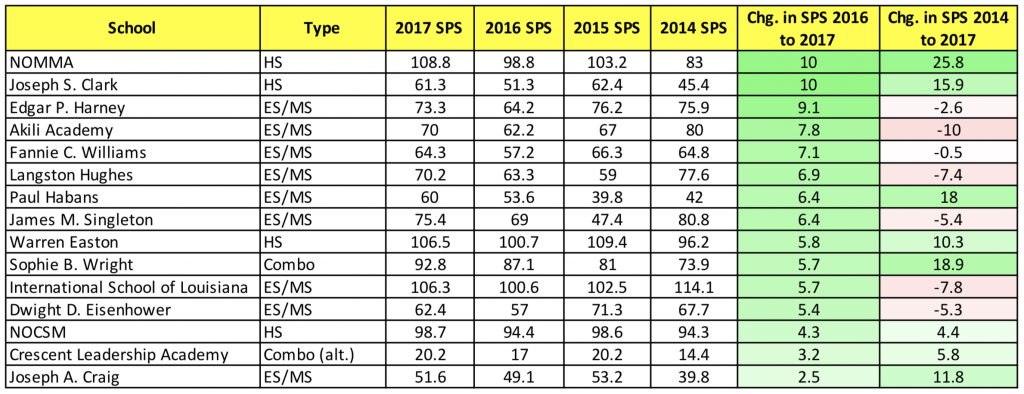
Turning to the brighter side of things, it’s interesting to note that many of the most-improved schools in the city last year also happen to be those that are rarely highlighted in discussions of New Orleans’ reforms. Although not listed above, Ben Franklin High School once again was recognized as the highest-performing public school in the state with a SPS of 141.3 (on a scale of 150).
The highest performing RSD school this year was Livingston Collegiate, an open-enrollment high school launched by the Collegiate Academies network last fall, which received an SPS of 115.9.
The 15 best performing schools over the past four years
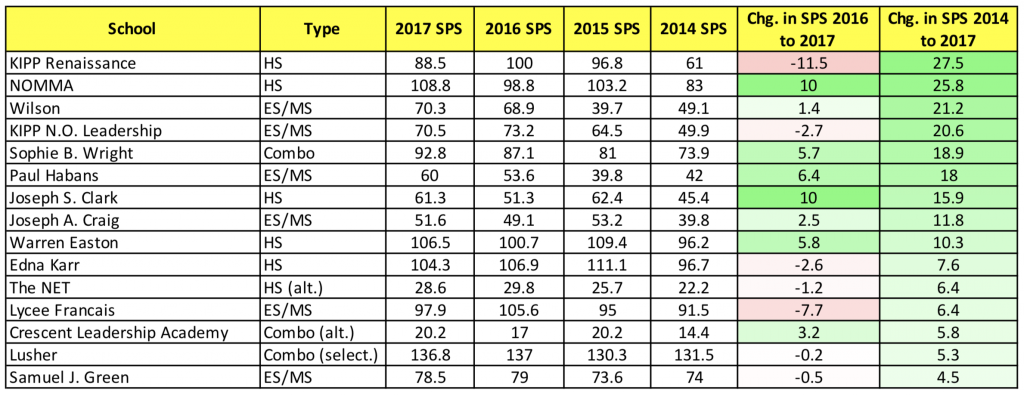
Taking a longer view of school improvement over the past four years, KIPP schools – KIPP Renaissance and KIPP N.O. Leadership – clinched two of the most-improved spots on the list. New Orleans Maritime and Military Academy, which employs what could be considered the ultimate “no-excuses” charter model, has also made significant progress, with its SPS rising nearly 26 points since 2014.
Sophie B. Wright and Paul Habans – along with Andrew Wilson, which was taken over by InspireNOLA in 2015 – have also seen double-digit jumps in their performance scores in the past few years.
Update: 11/10/17
I wanted to add two responses from readers regarding the data above. The first comes from Kathy Padian, who formerly oversaw charter schools for the Orleans Parish School Board:
Mahalia jackson is false – they didn't have a score of their own in 2014, LDE made OPSB pair them with Bethune
— Kathleen Padian (@BldBtrSchools) November 10, 2017
The second comment comes from Rhonda Dale, principal of Abramson Sci Academy, a open-enrollment high school in New Orleans East:


I think one issue that hasn’t been explored at any length is the fact that schools went to computer-based tests last year, and while the overall averages for Louisiana and New Orleans didn’t change much, I’d be interested to see a more fine-grained analysis that examines the impact of computer-based testing on low vs. high socioeconomic populations–the issue, I think, is that students who already have tons of computer access may do just as well as they did in the past or even comparatively better, while students who have limited experience with computers may have done worse than in the past. The average SPS might not change much, but the gap between high and low could widen. Worth exploring.
Bigger picture, I think it’s worth considering that in four years the state has used four different 3-8 assessments, essentially taking the “standardized” out of standardized testing:
2014: LEAP with vague claim to common core alignment, but practice tests were very light on actual common core skills
2015: PARCC
2016: LEAP again with more more of a commitment to common core alignment (practice tests were >50% based on PARCC practice tests)
2017: LEAP computer-based
All of which is to say, I’d be super careful about drawing any kind of conclusions about trends in school performance, especially comparing 2014 results to 2017. (I know the state does its best to standardize results of assessments so that data is meaningful one year to the next, but their processes are completely opaque to the average citizen, teacher, parent, etc.).
Take KIPP Believe, for instance, in the data set above: from 2014 to 2016, the score basically held steady at 83-79-84, so you could say the school was consistently performing at a reasonably high level for schools of its type. In 2017, it took an 11 point dip. Does this mean that we can say that the school is on an overall negative trajectory from 2014 to 2017 because its most recent performance? I don’t think so–more likely the students/teachers were thrown for a loop by the introduction of computer-based testing, had a down year because of staff turnover, or some other combination of difficult-to-quantify factors.
Another way of saying this: which school is actually serving its students better?
One that follows this trajectory:
2014: F
2015: F
2016: F
2017: C (improving!)
or one that follows this trajectory:
2014: C
2015: C
2016: C
2017: F (declining ): )
Me, I’d take the second school and assume the 2017 result was a fluke. But I’d also hope that people reporting this stuff will consider school SPS data (flawed as it may be, as other posters have pointed out) with a level of nuance demanded by what is at stake (adult careers, children’s futures, tens of millions in public money, and a good deal of political capital and momentum one way or another). I think an overall “narrative of decline” (or narrative of growth, for that matter) doesn’t capture much of the complexity that goes on in a school and how its children are educated, and talking about education reform in this way is ultimately harmful to the project of actually improving schools and serving students. Which isn’t to say that I’m against all accountability, testing, and data, only that it needs to be viewed with a really strong and multi-faceted microscope and then interpreted by very skillful scientists and storytellers.
What worries me is that the way the press often reports this stuff, and even the way the RSD and school board may end up judging this stuff, happens at this very surface, un-nuanced level, which is basically to perform some two-digit subtraction and then slap adjectives and single letters onto the work of thousands of students and teachers. I hope we can do better, and I hope that articles like this are the start of a deeper conversation rather than the conversation’s entire substance.
-Greg Seaver
(Acknowledgement: I work as a teacher at one of the schools mentioned in this article)
Peter C. Cook it really confused me, LoL
Ya heard. I️ totally agree with you that the drop in scores should be acknowledged. Also, I’m not at Akili anymore, I’m at KIPP Believe Primary. I keep an eye on my Akili peeps, though, and am also proud of them.
I think my point about this work being hard and losing good people is that it’s hard to stay consistent and steady in your performance when we cycle through people. And we cycle through people because this work is, as we’ve both stated, damn hard! Even when schools work really hard to make things not so hard for teachers, it’s still hard. We need a reserve team or something…
Dude, I know it’s hard. I’m not claiming it isn’t (and I definitely admire the hard work of the folks at Akili who really shined this year!). I just think there needs to be some recognition of the disappointing outcomes this year and we didn’t get any official acknowledgment of it from either OPSB or RSD when the scores came out this week.
Good question. It wasn’t really was a conscious decision on my part, to be honest. Maybe I was trying to avoid confusion with the whole “growth vs. proficiency” issue? Nevertheless, you make a good point.
Peter, why did you choose to use the labels highest performing rather than highest growth?
Julie and Rhonda, that’s all right too. Thank you!!
Part of the issue for high school is that bonus points were not awarded in the same way for growth this year because the state stopped issuing the eighth grade explorer exam and using that data to determine growth, instead substituting the 9th grade Alg 1 scores and some kind of all or nothing points system (like you can get 10 points if 50% of kids grow but zero if 48% grow). If you (like us) don’t let your ninth grade students come in and bomb that Alg 1 test, then it’s hard to pick up those bonus points. It’s confusing, but what is clear is that growth of students is NOT valued in SPS. If you ask me, there are better benchmarks to measure our kids’ performance and growth needs to be valued more. The whole SPS system incentivizes selective admissions and rewards schools for getting and keeping high performing kids from the start. Playing the SPS game is a distraction to the work of focusing on ACT and MAP reading growth. Do you know what SPS correlates with? Socio-economic status and race. There are literally schools that have lower performance of their students who have A’s.
Mahalia jackson is false – they didn’t have a score of their own in 2014, LDE made OPSB pair them with Bethune
Dude. This work is hard. And some of our best people leave schools to do other things…like write stuff.
Honestly not sure – could be a number of factors but I hope they take the opportunity to critically reflect on what’s been not working.
I don’t understand how some of these dropped in the double digits after years of growth. What’s happening? ????????♀️
It’s actually pretty intuitive to use, but once you get up-and-running, I’d be happy to answer questions.
Well, first you have to start with one of these things called a “spreadsheet”… Just kidding. I assume you’re talking about the graphs? I made it with Tableau – it’s free and you can download it from here: https://public.tableau.com/s/
I’m not sure I love that the two of you know each other now. It’s like pinky and the brain.
I want to do this for my homestate; teach me Obi Wan
We’ve got a ton to do.
Thanks, as always, Kelly – wish the news was better though 🙁
Good stuff, Pete. The 4-year graphs are really compelling – and stark